Monitoring
The Monitoring group in the “Node” area collects the observation screens for the current node: the state of streams, clients, hardware and services. The screens refresh automatically. Most of them only display data, but some also allow the object to be managed: “Streams” — to create and configure streams, “DVB adapters” — to add, configure and scan an adapter, “EPG Database” — to edit a channel. The configuration of the services, the accounts and the storages is placed in the Configure and Administration groups.
The central screen of the group — “Streams” — is covered in a separate section Streams.
Node overview
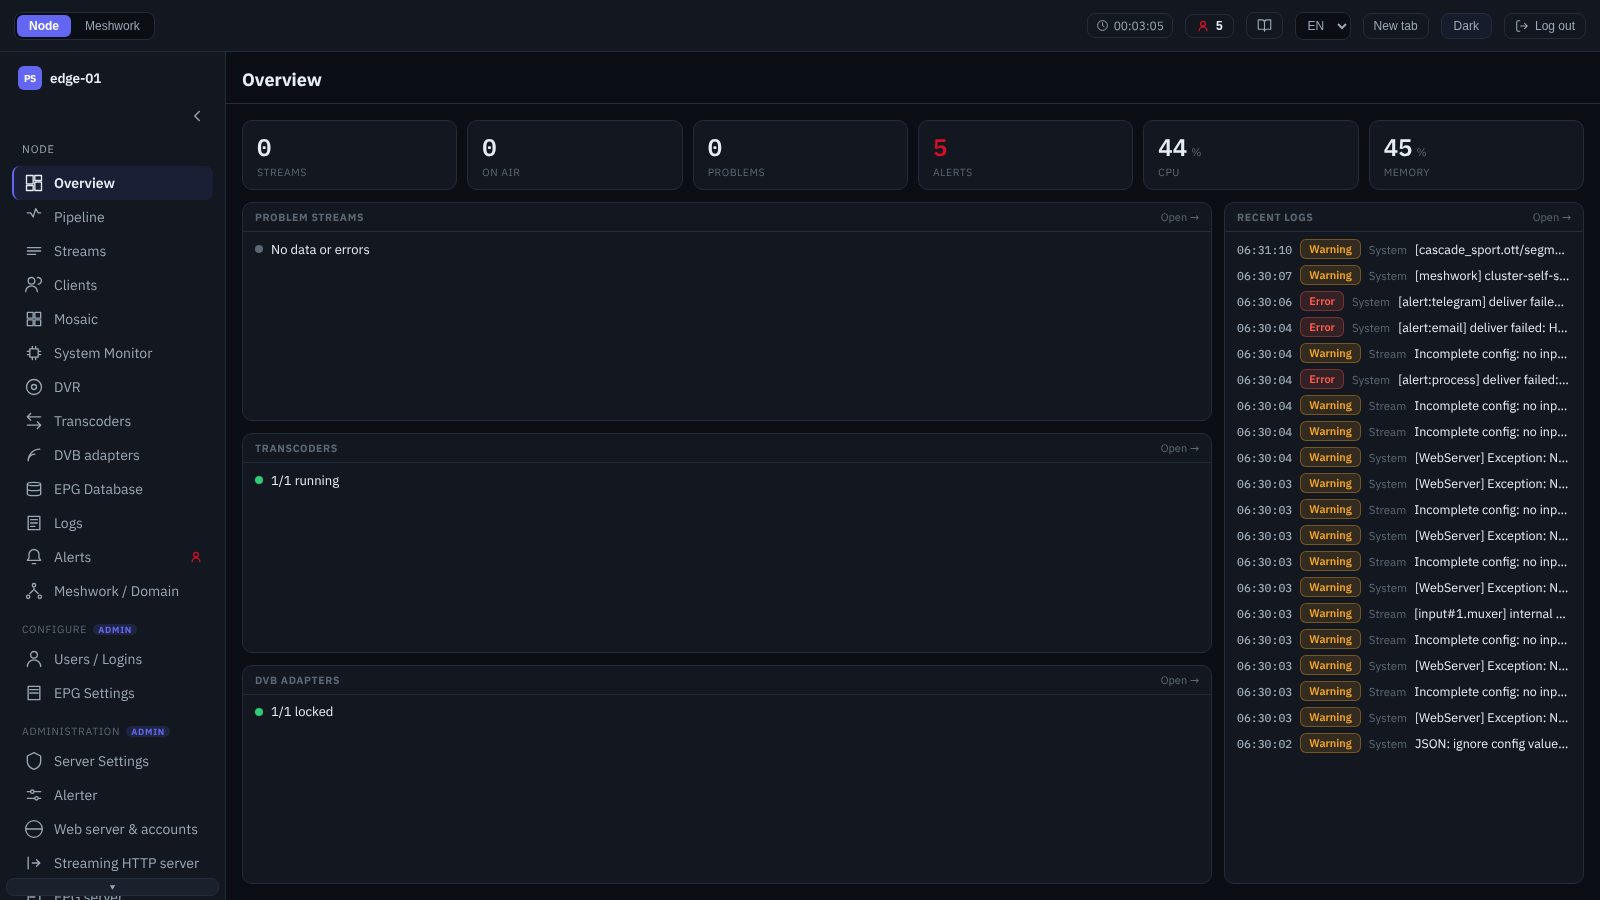
Node overview.
The start dashboard of the node. The top bar holds the key indicator tiles: the number of streams and how many of them are “On air”, the “Problems” counter, active “Alerts” (in the administrator role), CPU and memory load. Below are the panels of the problem subsystems: “Problem streams”, “Transcoders”, “DVB adapters” and (for the administrator) “Recent logs”; each one lists the faulty objects or a short “normal” summary; the panel heading leads to the corresponding screen. At the very bottom is the “Favorites” bar with the pinned signal charts of DVB adapters and mosaic tiles (they are pinned on their own screens). Node load assessment is covered in more detail on the System Monitor screen.
Pipeline
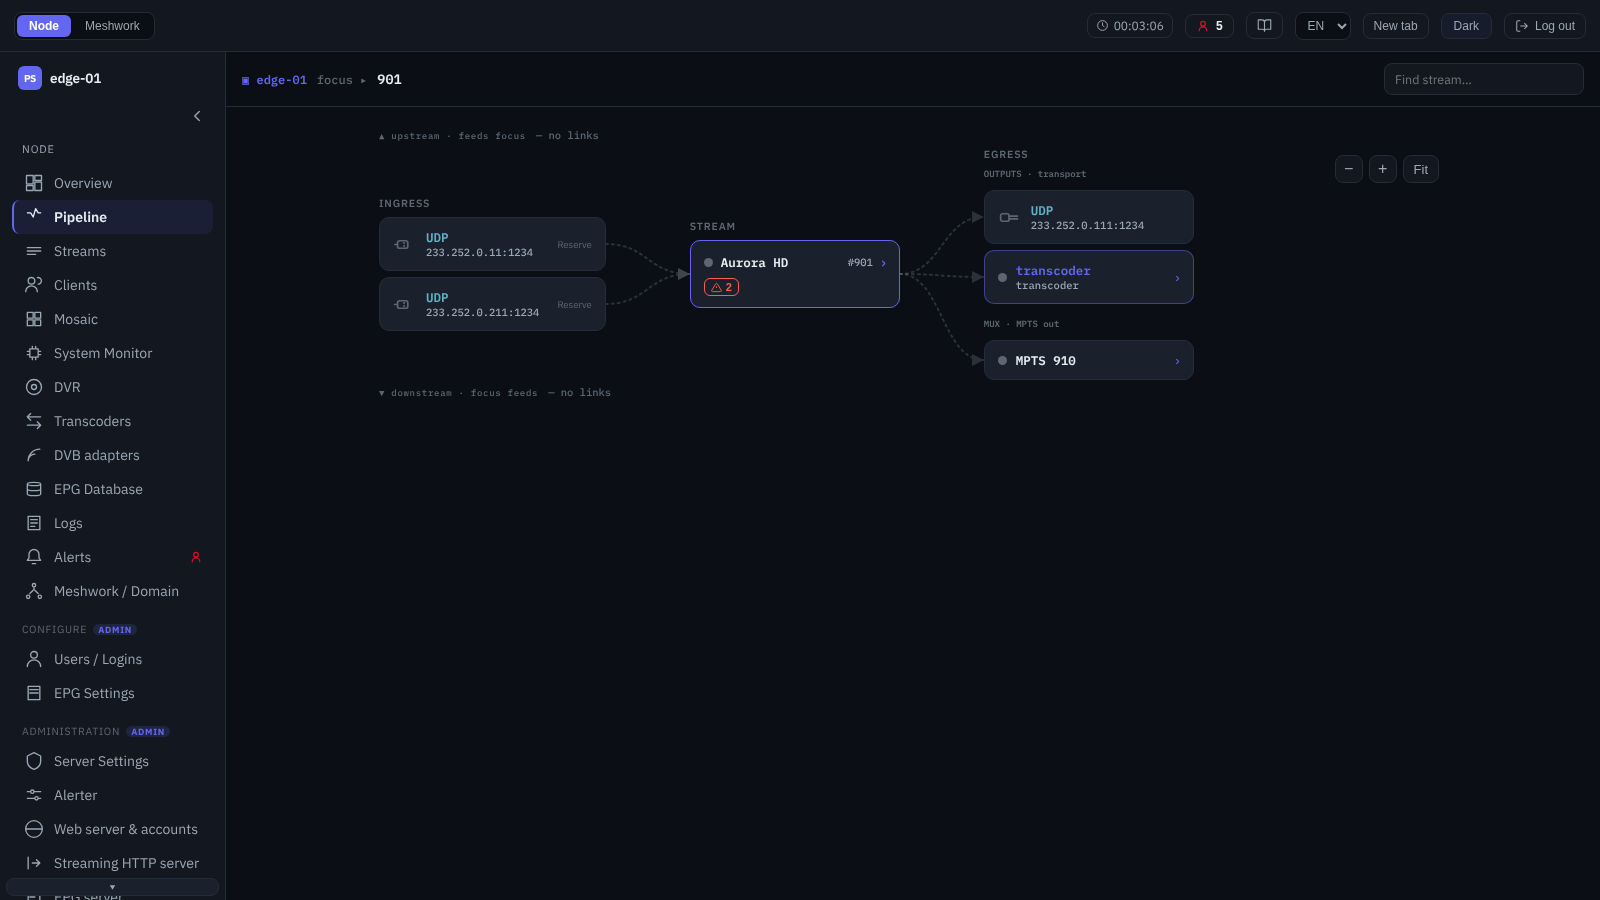
Pipeline graph: single stream (SPTS).
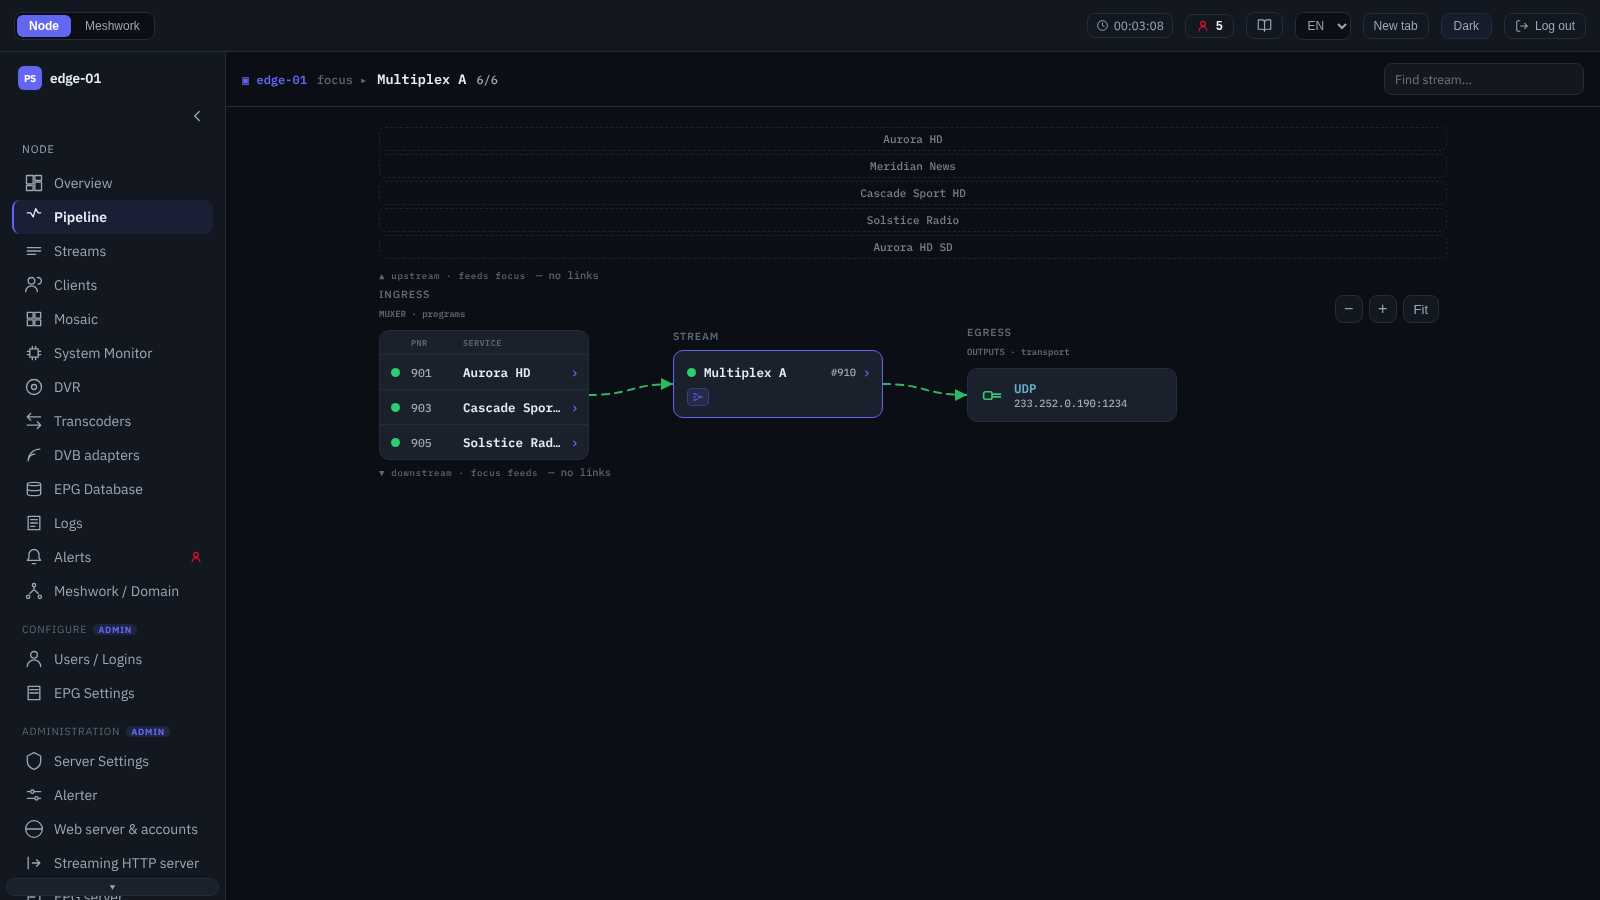
Pipeline graph: MPTS multiplexer.
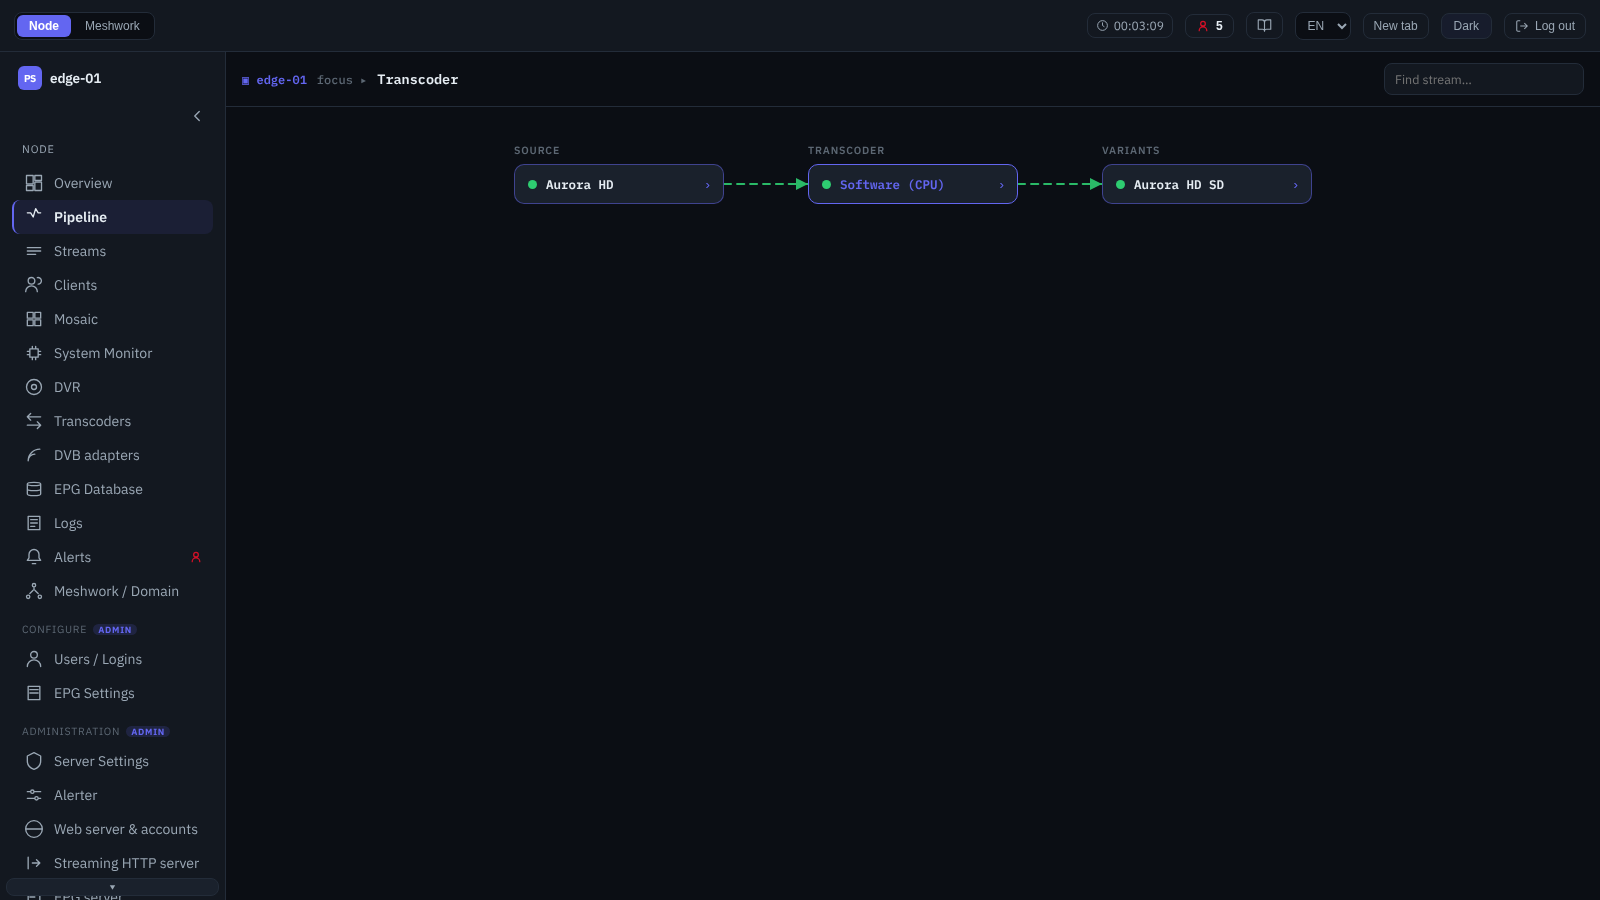
Pipeline graph: transcoder.
The processing graph of a single selected entity: how the sources, the stream and the outputs are linked into one pipeline (INPUT → STREAM → OUTPUT). The focus view is selected by type: an SPTS or MPTS stream (with the incoming and outgoing programs of the multiplex shown; for the stream list see Streams), Adaptive bundles, a transcoder (Transcoders) or a DVB adapter (DVB adapters). Entities are traversed by the neighbor arrows, by name search or from other screens; the current focus is kept in the address (a direct link can be shared). A separate block gathers the local relays of the node (peer), while the “doors” to the adjacent nodes open their admin UI at the same focus. The transcoder cards — both the input one and the output one — lead to the graph of that transcoder; for the input a decoder must be set for this. The cards of the inputs and outputs in the transports of the shared domain catalogue carry a “Show in library” button (Library — this feed). The graph shows only active streams and IO; paused inputs and outputs are not displayed in it. The transmission model is described in Transmission model: Stream, Sender, Receiver, Peer, stream processing on a node — in Streamer: implementation details, MPTS multiplexes — in MPTS streams.
Clients
A list of the connected receivers, arranged in tabs by delivery protocol: “HTTP / OTT”, “SRT”, “PS1” and “RIST”; each tab carries a live counter of active sessions. The operationally important columns are shown: the client (with an origin mark — “Local login” or “External billing”), address, stream, login, for SRT — the mode (caller/listener), losses and RTT, for OTT — the session type and delivery “Quality”, the connection time. Search works over the list (name, login, address), long lists are split into pages. Expanding a row opens the full set of session diagnostic counters, updated in real time. The administrator has the “Disconnect” action available — it terminates all sessions of the selected login. Transmission protocols are described in Peer protocols for reliable transmission, OTT delivery — in OTT and DVR, receiver accounts — on the Configure screen (2. Client behaviour).
Mosaic
A preview wall: live frame thumbnails — one tile per active SPTS stream and per program of an active MPTS (multiplex programs are marked with an icon). The grid adapts to the screen width, the tile size is switched by the “Size” control (1, 1/2, 1/3). Paused and stopped streams do not appear in the mosaic. Clicking a thumbnail opens the enlarged frame; the star pins the tile to “Favorites” on the Node overview screen.
Original frame
An enlarged view window for the selected frame at its original resolution — for a detailed visual inspection of the picture. Inside the window the adjacent mosaic tiles can be paged through.
System Monitor
System Monitor.
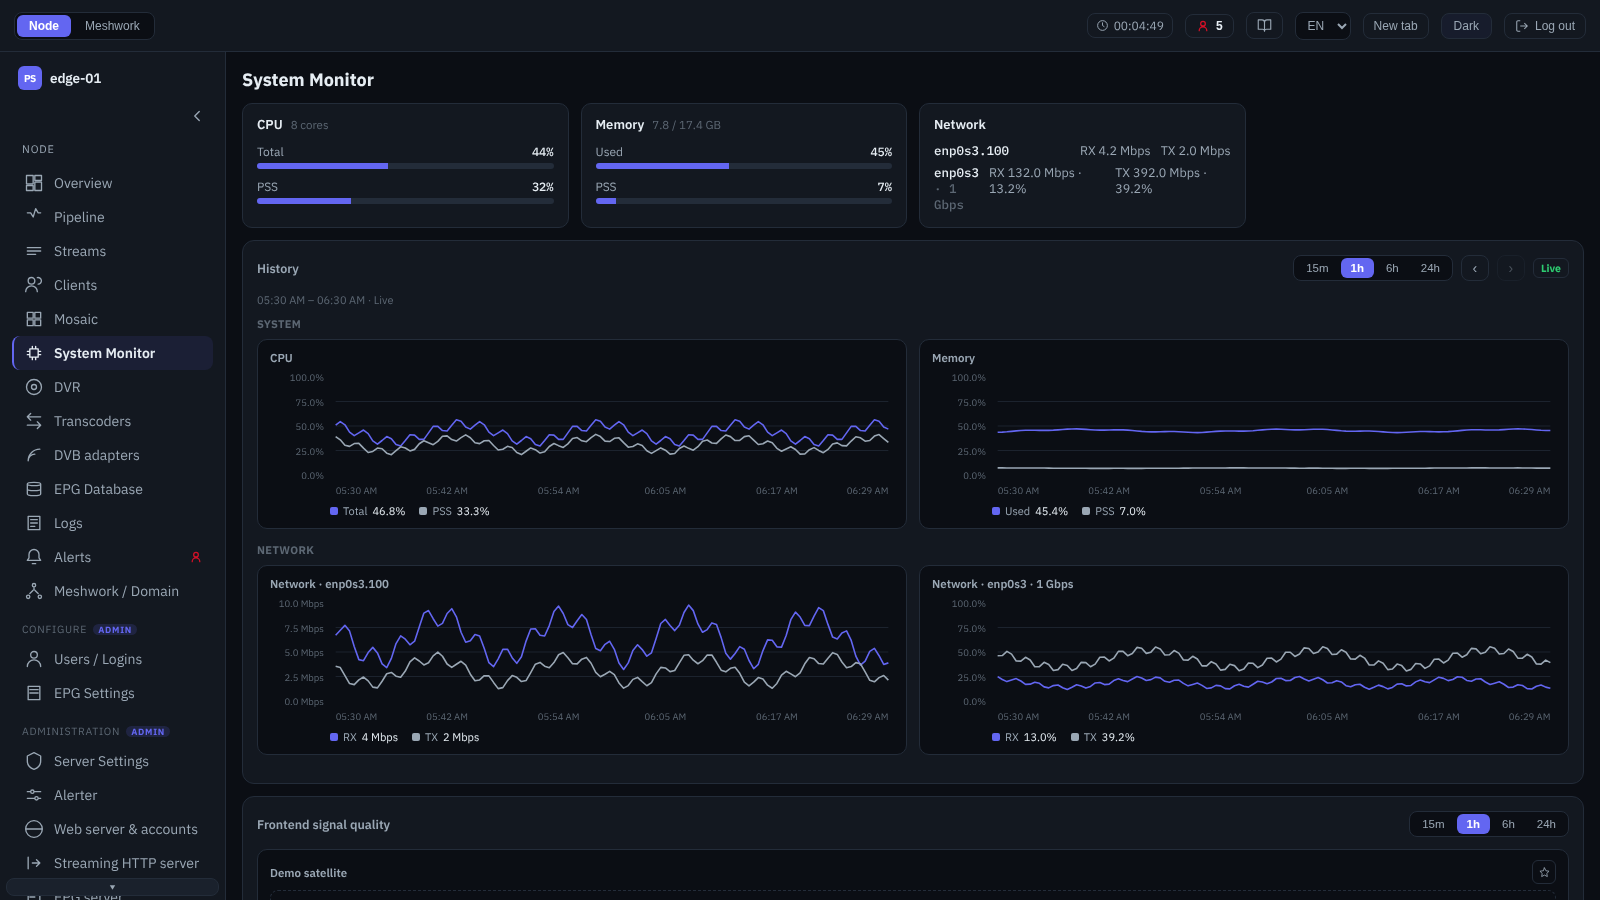
The server state presented as cards: “CPU” (overall load and the share of the PSS process, number of cores), “Memory” (used and the PSS share, size in GB), “Network” (per interface — receive/transmit and link utilization, with VLANs nested under the physical adapter) and the hardware acceleration cards (NVIDIA — GPU/memory/decoder/encoder, Intel VPL). Below are the charts of the indicators over time. On nodes with DVB tuners a separate section shows the signal quality charts of the frontends (Signal monitoring). It helps to assess the load headroom; resource tuning recommendations are given in Node performance tuning, external metric collection — in Connecting external monitoring systems.
DVR monitor
DVR storages monitor.
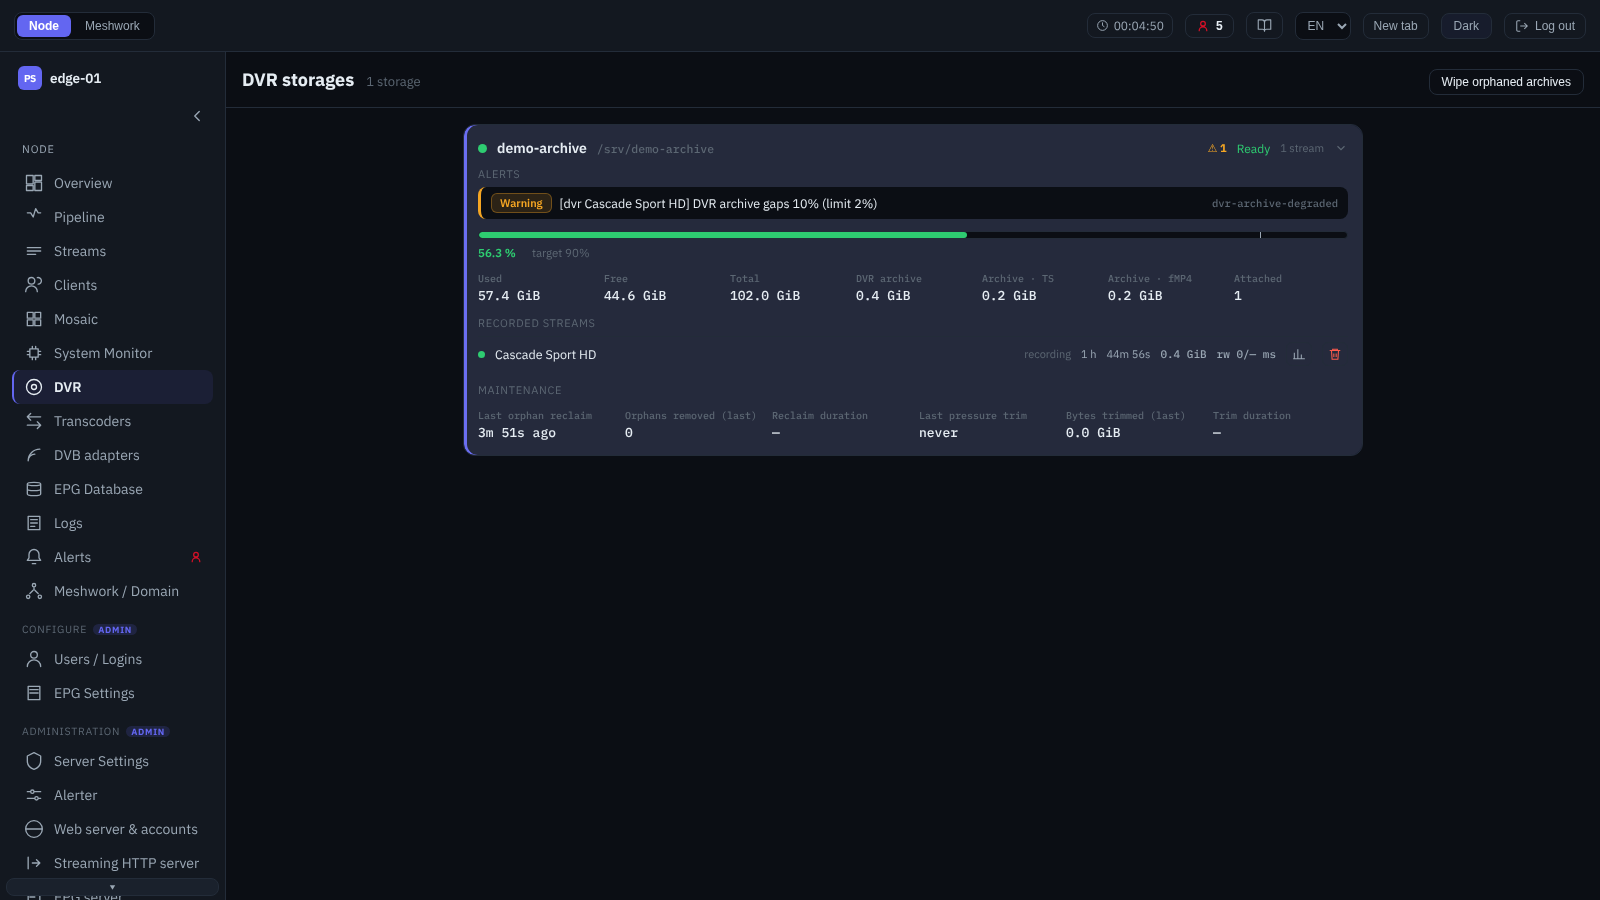
Read-only observation of DVR recording per storage. For each storage — the fill level relative to the cleanup target (a bar with the target mark), the volumes (used, free, total, archive size broken down into TS/MP4), the “Disk pressure” flag, the current background task and the number of bound streams; the active alerts of the storage are shown alongside. Expanding shows the archive streams line by line (recording / idle, retention depth, accumulated volume, read/write latencies) and the maintenance diagnostics (collection of orphaned directories, trimming under disk pressure). For a stream the Stream statistics window opens; the administrator additionally gets archive cleanup for an individual stream and the general “Clean up orphaned archives” command. The storages themselves are configured on the DVR storages screen; archive recording and playback are described in OTT and DVR and DVR: the stream archive.
Transcoders
The Transcoders screen.
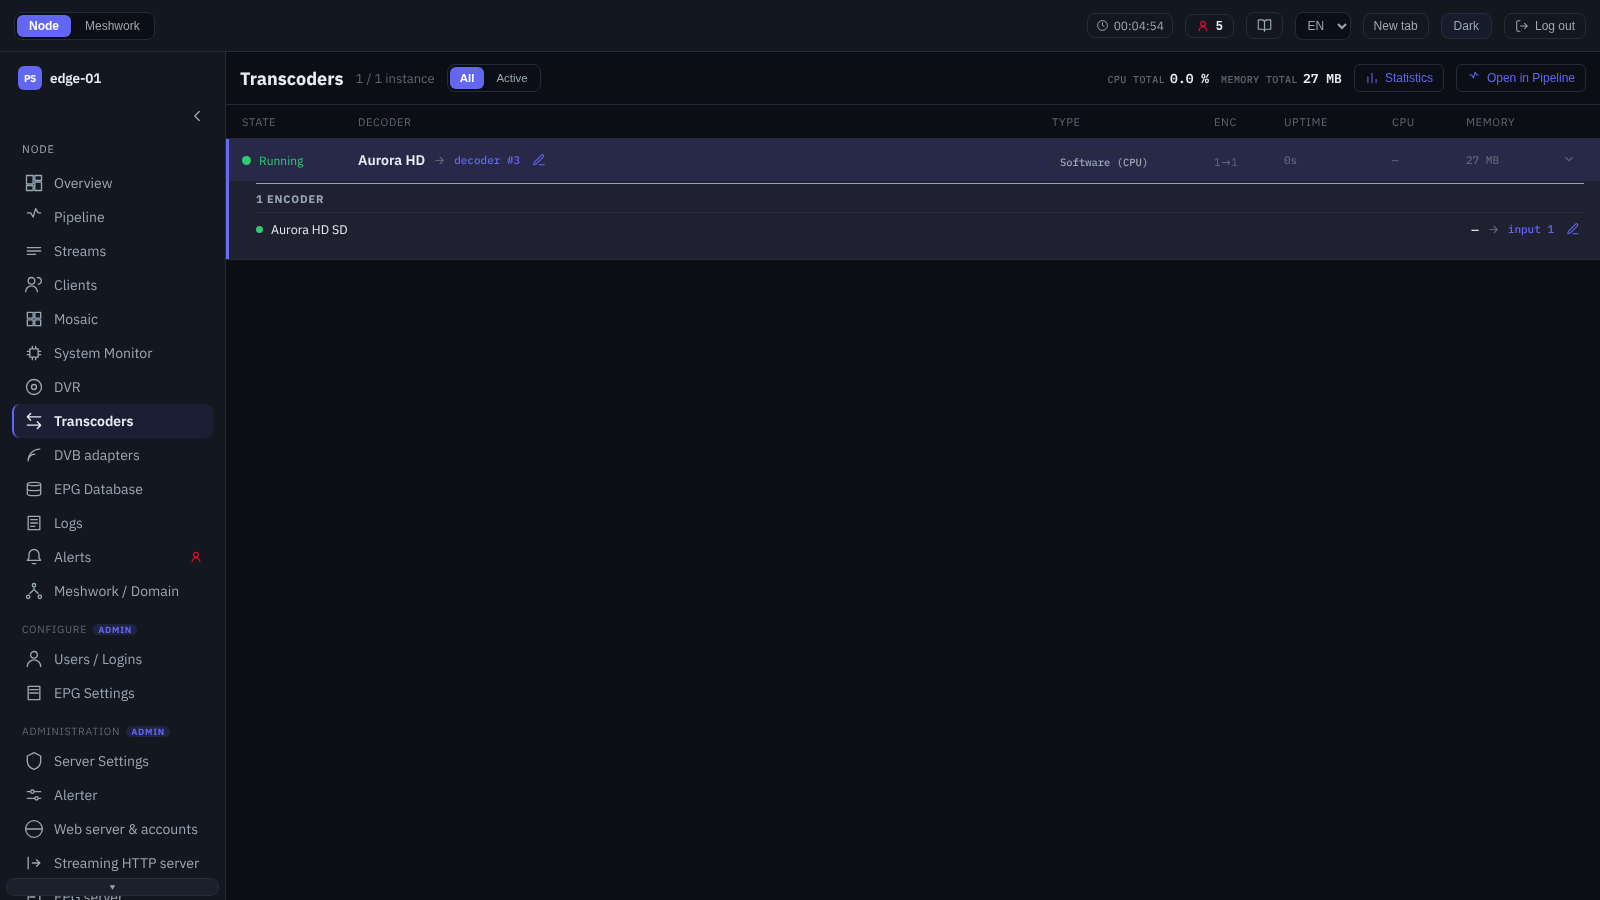
A list of the active transcoder instances of the node, with an “All / Active” filter. The header shows the aggregate “CPU total” and “Memory total” load, as well as the actions on the selected instance: “Statistics” and “Open in pipeline” (Pipeline). Per row — state, decoder (source), type, number of encoders, uptime, CPU and memory; expanding shows the encoders with their output parameters (video codec, resolution, frame rate/scan, audio codecs, actual bitrate). The pipeline labels open the statistics of the corresponding stream. For the administrator a configuration button is available at the decoder and at every encoder: it opens the editor of the corresponding stream on top of the list (Configure stream). Transcoding capabilities and configuration are covered in Transcoders, monitoring — in Monitoring, package and driver installation — in Transcoders.
Transcoder instance
The card of an individual transcoder — a statistics window opened from the screen header or from the central node of the transcoder graph. It shows the source (decoder), the list of encoders (1 → N), the resources (CPU, uptime, PID, memory) and the process log: the last exit code, the current and the previous run logs (with copying) — for diagnostics. When opened by a link, the window also expands and highlights the row of this instance in the list behind it, so that after the window is closed the operator stays on it; if the row is hidden by the “Active” mode, the list is not scrolled to it.
DVB adapters
The DVB adapters screen.
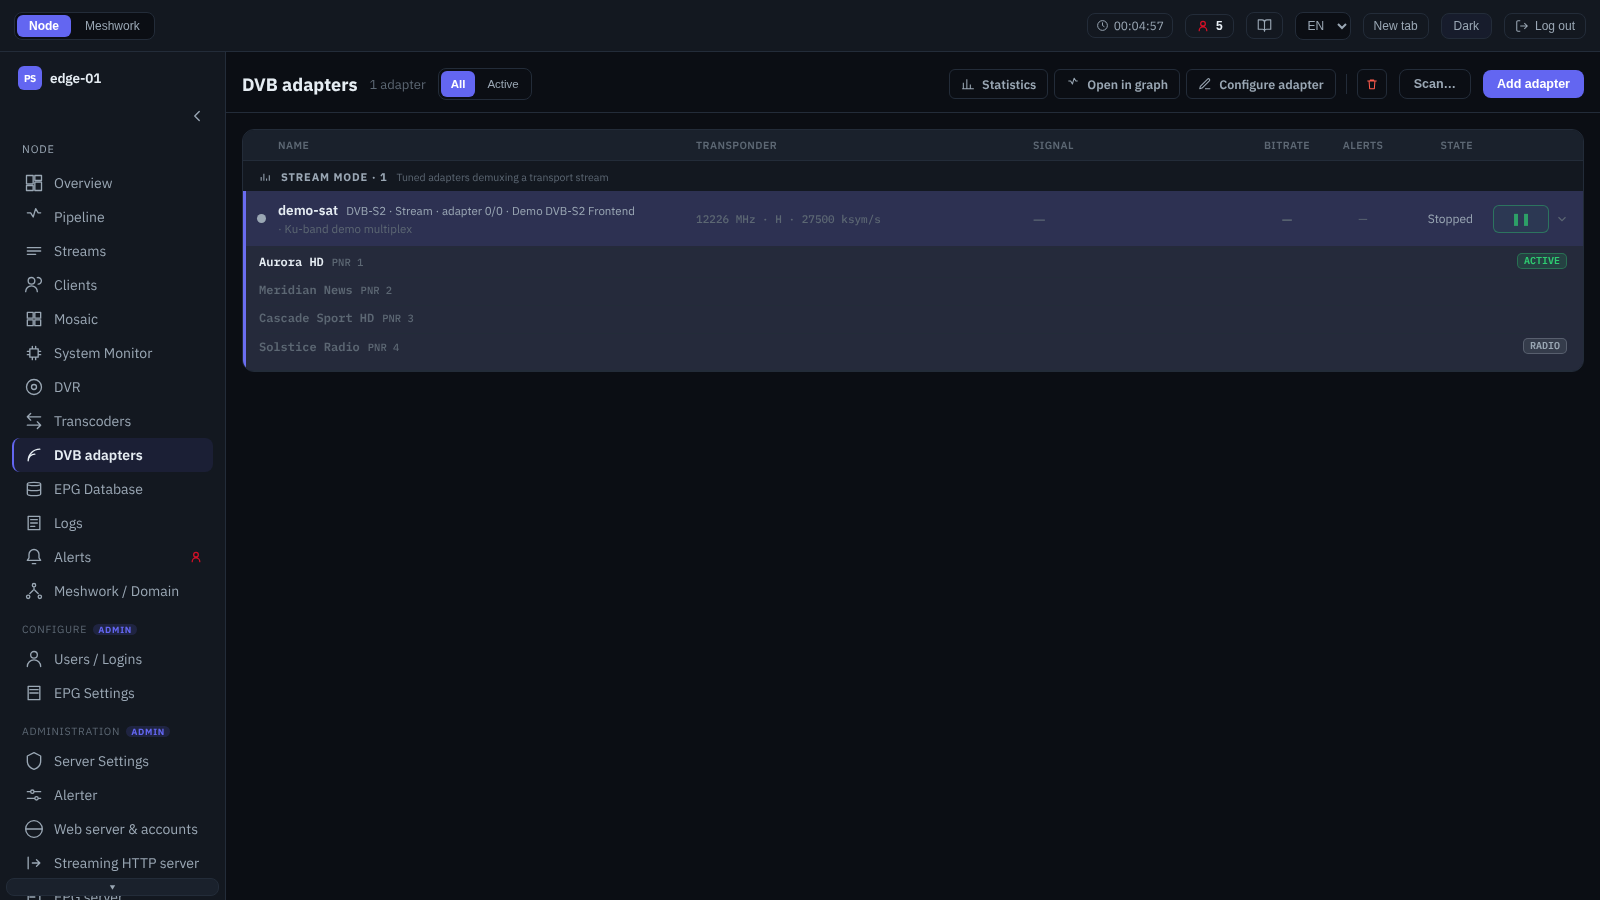
A single DVB reception screen: the adapter configuration enriched with live state (signal lock, quality, bitrate). The rows are grouped by mode — “Stream mode” (reception into a stream) and “FE Monitor” (monitoring of a frontend tuned by another application); the columns are name, transponder, signal, bitrate, alerts and state; each row has a pause toggle. The actions on the selected adapter are placed in the header: “Statistics”, “Open in graph” (Pipeline), and also (for the administrator) “Configure adapter” and “Delete adapter”. The header also holds the “All / Active” filter, “Add adapter” and “Scan…” (for the administrator). DVB reception is described in DVB receiver, adapter monitoring — in Signal monitoring.
DVB adapter editor
The window for adding and configuring a DVB adapter. “Mode” and “Broadcast system” are set when the adapter is added and cannot be changed afterwards — they determine the set of settings. The hardware is selected from the list of detected frontends (see Hardware). Stream mode provides the tuning parameters (frequency, symbol rate, FEC, modulation and so on — according to the broadcast system), the LNB section for satellite reception, “T2-MI”, “BISS descrambling” and “CI/CAM descrambling”. Muting of the adapter alerts and the “Advanced” section (extended parameters) are available in both modes; FE Monitor mode reads the signal without retuning the tuner. Reception and descrambling are described in Adapters, Descrambling and T2-MI decapsulation.
DVB scan
A channel search wizard on a free tuner (for the administrator). It proceeds in steps: selection of the tuner and the broadcast system, selection of the source — “Catalog” (satellite, cable or terrestrial with LNB parameters) or “Blind scan” over a frequency range; then the transponders are swept with progress indication and accumulation of the multiplexes found, each with its list of services. The multiplexes found can be added one by one (the adapter configuration window opens with the parameters pre-filled) or several can be selected and added at once; the names are generated automatically and checked for duplicates. Channel search is described in Scanning.
Adapter statistics
A window with the live parameters of the selected adapter. It contains: the state summary and the tuning parameters, the active alerts, the signal history charts (level, SNR, BER, UCB), the “Metrics” section (frontend, lock status, frequency, SNR, signal level, error counters, and for Stream mode — the bitrate), the list of programs, “T2-MI carriers”, “BISS descramblers”, “CI/CAM module”, “Profiler” (processing thread load, DVR ring overflow) and the adapter log. The administrator can use “Reset statistics”. It serves for antenna alignment and for checking the stability of reception (Signal monitoring).
Test streams
The test streams screen — generation of service streams for checking signal paths (Test streams). The section is in preparation.
EPG Database
The collected program guide and the state of its sources. The screen contains the tabs:
- Database
Viewing of the accumulated guide: source selection, the channel list with search and filtering by sets, the schedule of the selected channel by day (day and language switching, the current event highlighted). The administrator can edit a channel — name, time zone, icon, membership in sets.
- Source status
The import status for each source: state, the time of the previous and the next update, the number of channels and events, the error; the administrator can force an update of a source.
EPG import and processing are described in EPG Database and EPG/XMLTV import; the sources and their configuration — in Source configuration and on the EPG Settings screen.
Logs
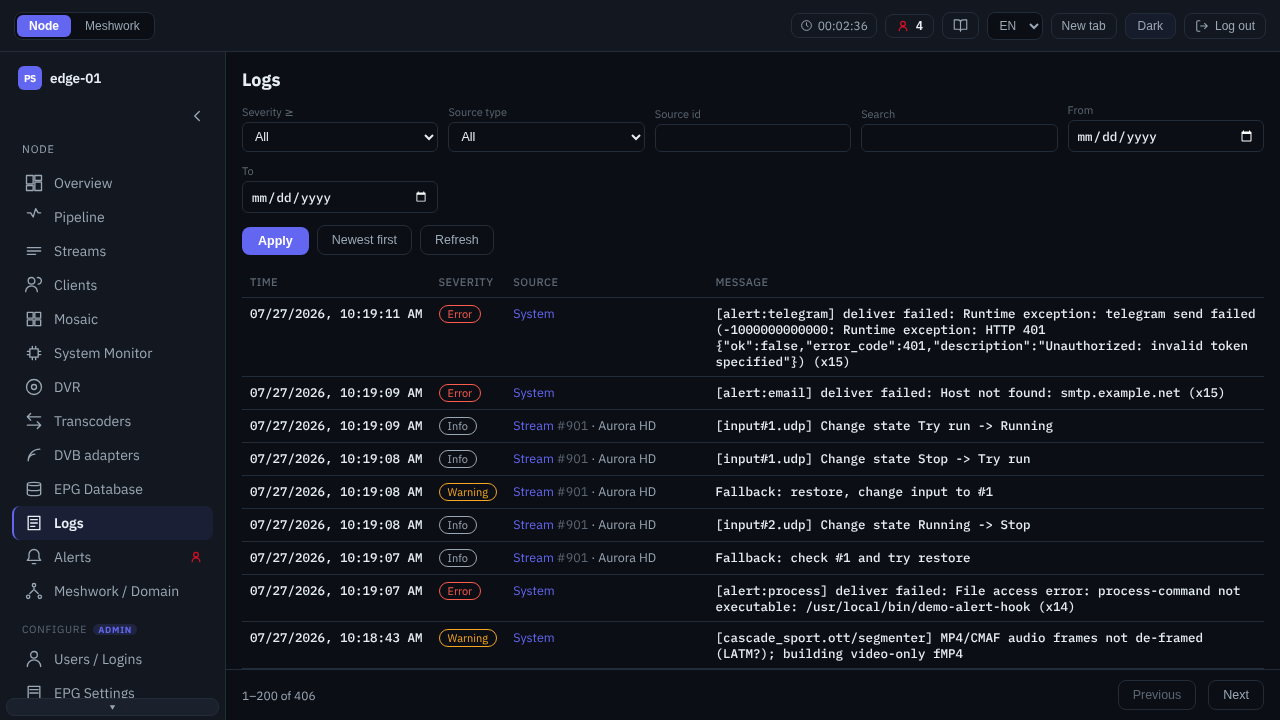
Logs.
A structured event log of the node (available to the administrator) with filters and paginated output. Selection is by severity (“Severity ≥”), by source type and identifier, by message text and by date range; the sort order is switchable (newest / oldest first). The columns are time, severity, source and message; a stream source opens its Stream statistics window, other sources lead to the dedicated screen. It serves for diagnostics and incident analysis.
The source of a record is denoted by the object type, and for streams also by the number and the name: Stream #43 · orig CBC HD; if no display name is set, the stream name is substituted. Streams are labelled with the same name and number in the selection list of the “Source ID” filter. Records made by an input or an output of a stream are attributed to the stream itself and show its name, while the particular input or output is named at the start of the message text.
Alerts
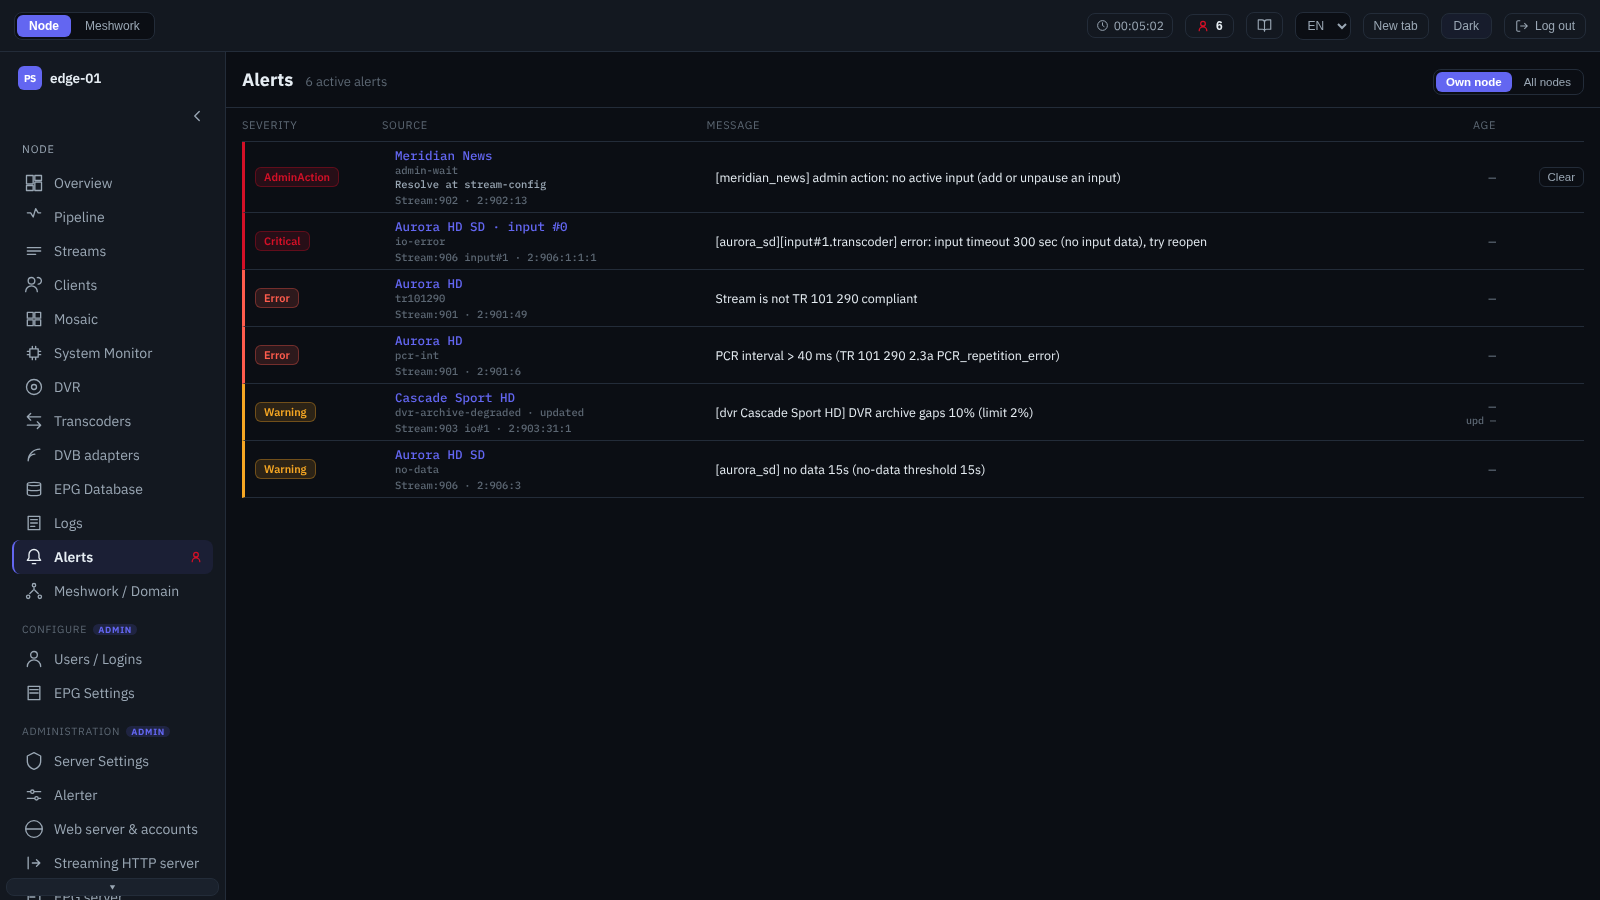
Active alerts.
A consolidated screen of the alerts in force: own (of the current node) or those of the whole domain — switched by the scope in the header. The screen shows only the active set — an alert that has been cleared disappears from the list. The columns are severity, source, message and age; a stream source opens its Stream statistics window. In a domain of several nodes the row shows the originating node (with a link to its admin UI). Alerts at the administrator-action level are provided with a “Reset” button (manual acknowledgement) that acts on their own node. For such alerts the place where the cause is to be removed is shown under the source; when it is an input or an output, the row serves the administrator as a link and opens the editor of the owning stream (Configure stream). An alert that arrived from another node gives no link — the stream numbers are each node’s own. The alert model, its analysis and the full list of codes are given in Alerts (alerter) and Alert code catalog; threshold configuration and external delivery — on the Alerter screen.
Meshwork / Domain
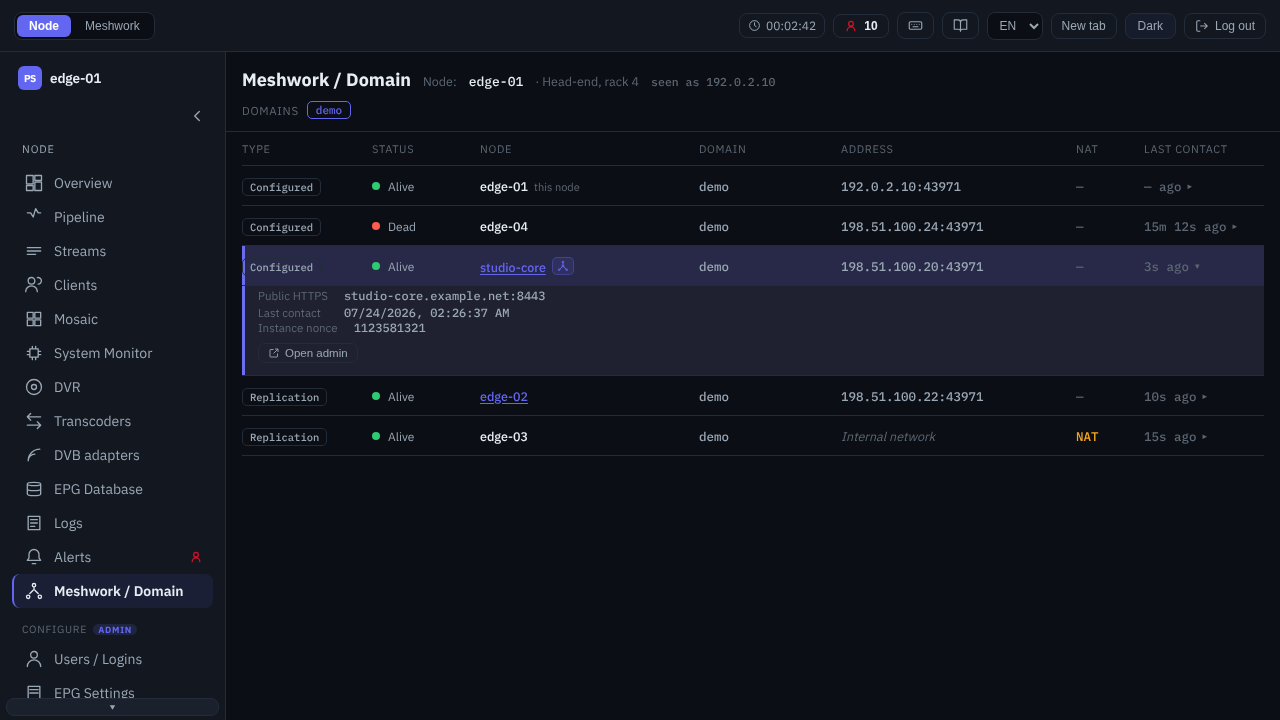
Meshwork domain: node peers.
A view of the Meshwork network from the standpoint of the current node. The header shows the node name, its note, the observed external address (“seen as …”) and the linked domains; when there are no domains, “No linked domains” is displayed.
The body of the screen is the peer table: the domain nodes visible from this node, with the “Type” (“Configured” or “Replication”), “Status” (“Alive” / “Dead”), “Node”, “Domain”, “Address”, “NAT” and “Last contact” columns. The configured neighbours are listed first, then the automatically discovered ones, and within each group by node name. The row of the current node is marked “this node”, a super-node is marked separately, keep-alive failures with the “Degraded” label; a node behind NAT shows “Internal network” instead of an unreachable private address.
The arrow at the end of the row expands the details of the peer: the public entry points (HTTP and HTTPS), the exact time of the last contact, the contact telemetry (latency, the number of consecutive and total failures, the last error), the declared and the observed addresses and the instance nonce; from here a button opens the admin UI of the adjacent node. The network-wide view of the domain peers is Node peers; the shared resource catalogue of the domain is shown by a separate screen, Library.
The concepts and the summary screens of the network are described in the Meshwork section (map — Network map and resource catalog, catalog — Shared resource catalog, peers — Peers and secrets); the screens of the “Meshwork” area — in Meshwork.
