Meshwork
The Meshwork area (the area switch in the top bar) collects the consolidated screens of the domain node network: the domain overview, the transport topology, the peer membership, the individual transport links and the shared catalogue of network resources. This is a top-down view of the whole network, as opposed to the screens of the “Node” area, which show a single node.
The network concepts, the domains, peer autodiscovery, operation behind NAT and the alerts are described in the Meshwork section.
Meshwork Overview
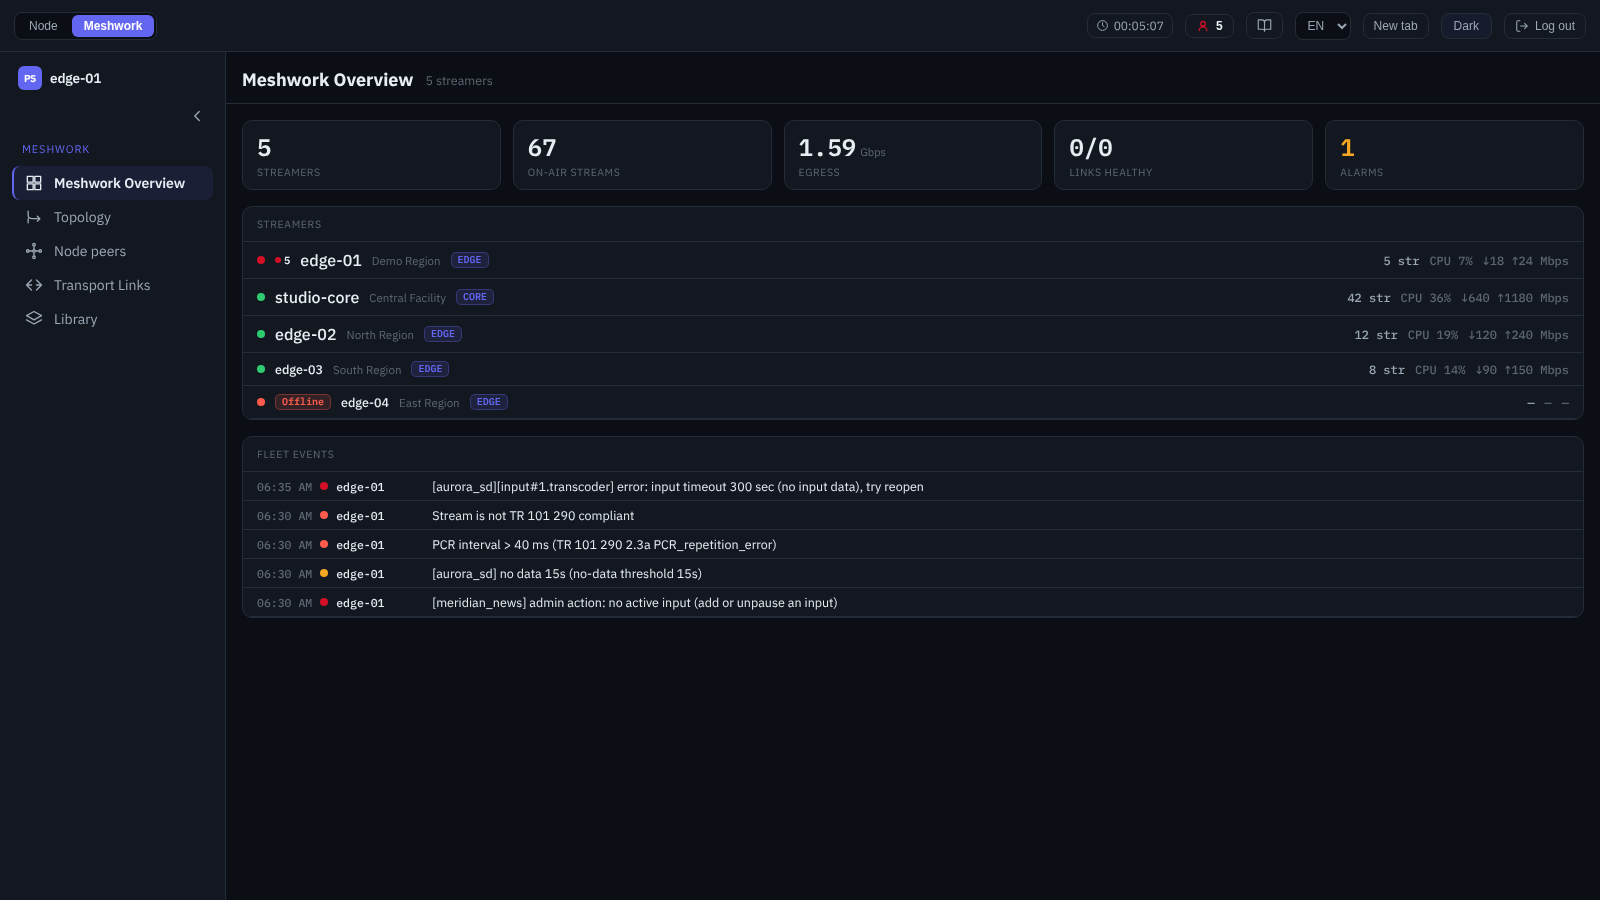
Meshwork Overview.
The domain summary panel: all network nodes and the key domain metrics in a single screen. The header shows the number of nodes; below it are the metric row and the lists.
The metric row combines the “Streamers” (number of nodes), “On-air streams”, “Egress” (total outbound bandwidth, Gbps), “Links healthy” (healthy transport links against their total number) and “Alarms” tiles. The “Alarms” tile counts the faulty nodes and the faulty active links and is highlighted when the value is non-zero.
The “Streamers” panel holds one row per node: the state indicator, and for a faulty node a text label next to it as well (“Degraded” or “Offline”); the node name, the region and the role, the number of on-air streams, the CPU load and the traffic (in/out). The row of a node whose admin UI is reachable leads to its screens in the “Node” area. For the administrator role, a counter of the active alerts of the node is shown next to the state.
The “Fleet events” panel is visible to the administrator and aggregates the active alerts of all nodes: the time, the node the event belongs to (a link to its admin UI) and the text. The network model is described in Meshwork, the alerts in Alerts (alerter).
Topology
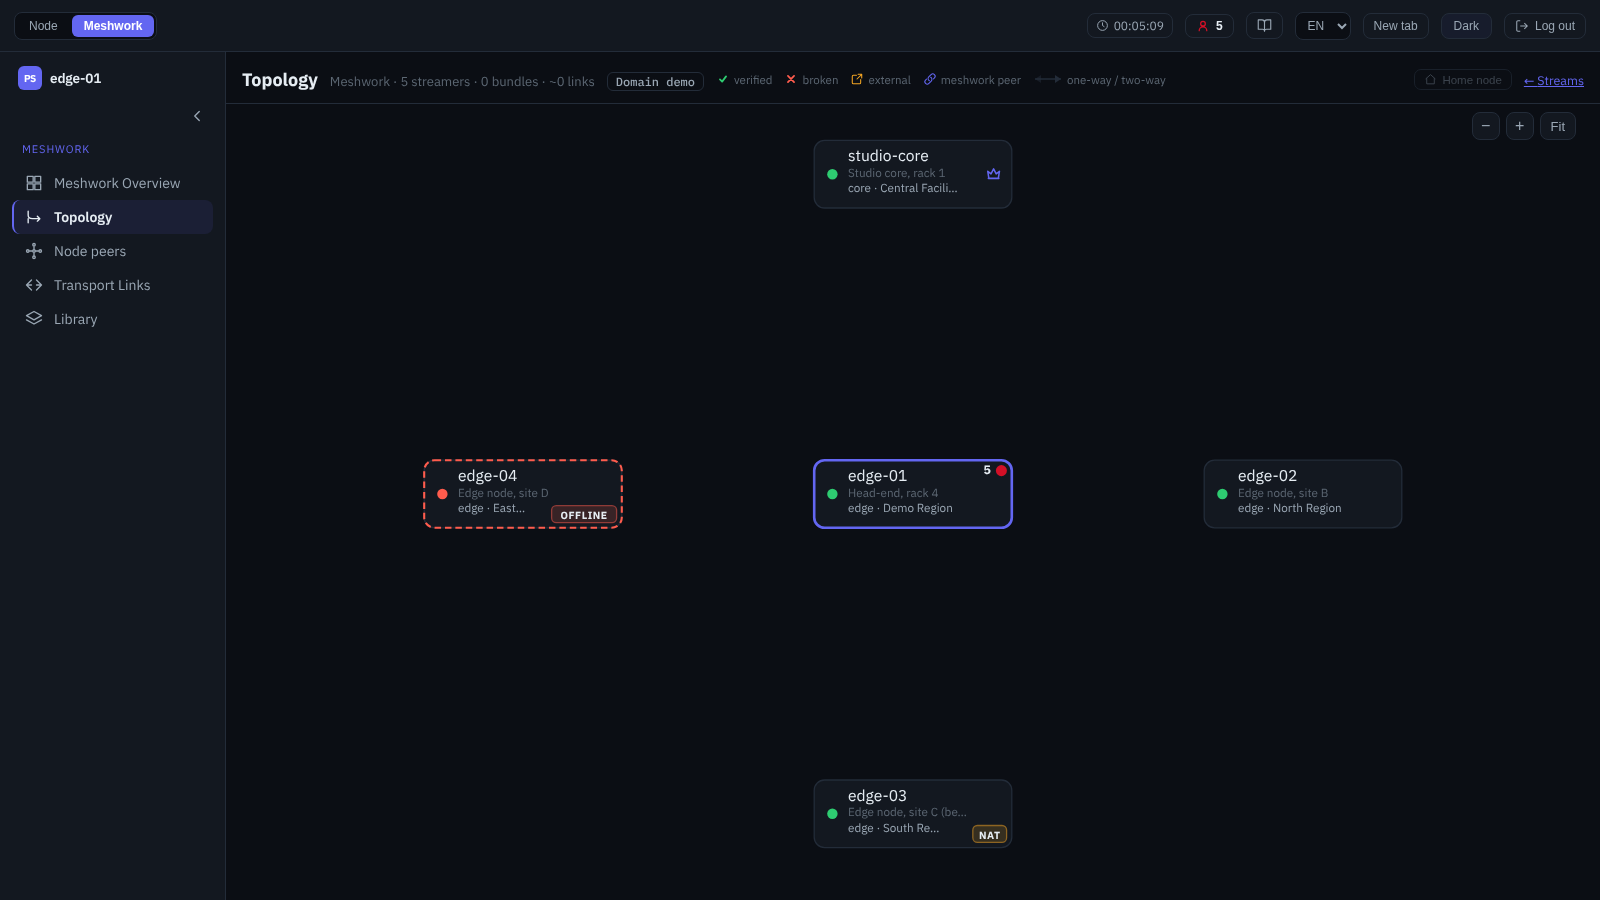
Fleet topology graph.
The transport graph of the domain: the network nodes and the transport links between them, aggregated into bundles (several one-way links of the same direction are shown as a single edge). The screen is graph-based; the header shows the number of nodes, bundles and links, the domain of the connected node, the link marks and the “Home node” button that returns the centre of the graph to the current node.
The graph shows which nodes are connected, where a link is verified and where it is inferred, which links are external (outside the domain) and which nodes are behind NAT. The marks distinguish a verified link, a broken one (peer offline), an external link, a link between Meshwork peers and the direction (one-way or two-way). A node may carry a counter of active alerts. Clicking a node moves the centre of the graph onto it (clicking it again opens its admin UI); clicking a link opens Transport Links filtered by the selected bundle. The network map and its marks are described in Network map and resource catalog, the node fields in Network map, operation behind NAT in Nodes behind NAT.
Node peers
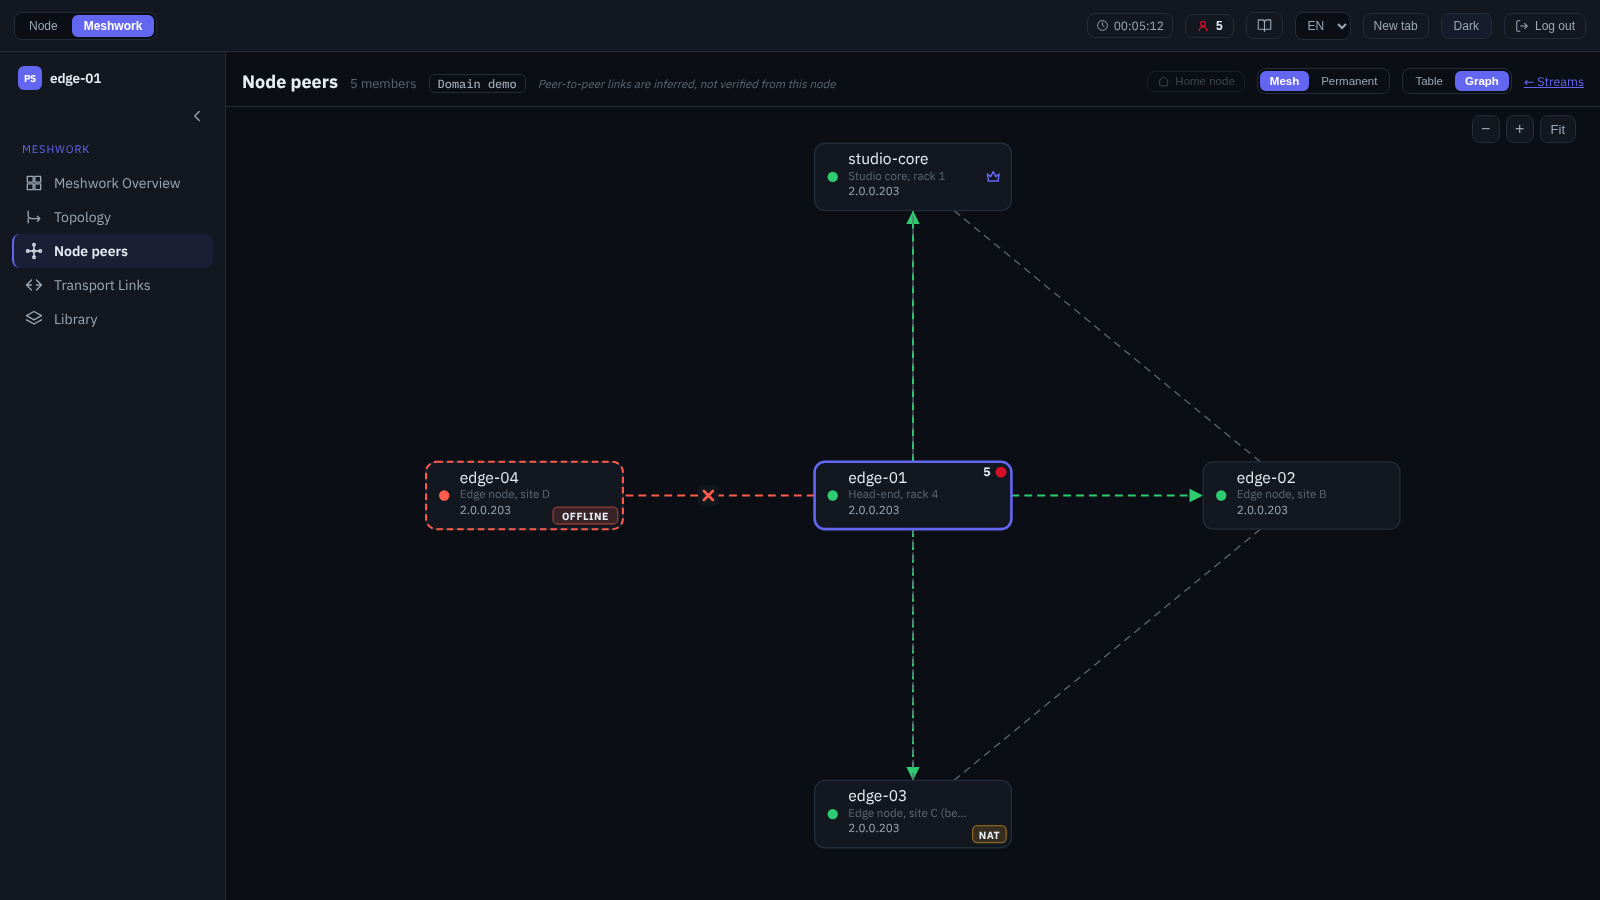
Node peers graph (mesh).
The domain membership and the links between its members. A graph scope switch “Mesh / Permanent” and a view switch “Table / Graph” (graph by default) are available.
In graph mode, “Mesh” shows all domain members centred on the connected node: the reliable keep-alive star originating from it and the inferred links — not verified from this node — between the remaining pairs. “Permanent” builds the graph of the configured peering: the nodes and the directed links taken from the peer lists of every node (the arrow shows the direction of the configuration, two-way when it is mutual). The “Home node” button returns the centre to the current node.
In table mode the members are listed with the “Node”, “Address”, “Type” (“Permanent” or “Auto”), “Version”, “Status” (“Alive” / “Dead”, with the “Degraded” label on keep-alive failures), “NAT” and “Last seen” columns. A node behind NAT shows “Internal network” instead of an unreachable private address. The node name is a link to its admin UI (an unreachable peer is rendered as plain text); the row provides a button that opens the admin UI. The row of the current node is marked and expands the “Meshwork traffic” panel — the breakdown of the outbound traffic by share (“Base”, “Peers”, “Library”, “Alerts”), the TX/RX rate and the exchange counters. The row fields are described in Network map, peer configuration in Peers and secrets, operation behind NAT in Nodes behind NAT. The view of the peers from the standpoint of the current node is the Meshwork / Domain screen.
Transport Links
The individual transport links between the domain nodes — the very links that “Topology” aggregates into bundles. The header shows the “Links” (total), “Healthy” (against the total number) and “Verified” metrics. When arriving from the “Topology” graph, the table opens filtered by the selected bundle; the filter is cleared with the “← all links” link.
Each row describes one link: the state indicator, the direction (the “Link” column, node → node), the “Proto” (PS1, SRT and other transport channels), the “Stream”, the “Identity” (“verified” or “inferred”, with the “reserve” mark for a backup link), the “Scope” (“internal”, “external”, “local” or “unknown”) and the telemetry — “TX→RX Mb/s”, “RTT” and “Loss”. The scope is taken from the side that connects by itself, so for the UDP, RTP, Pro-MPEG and RIST links it is “unknown”. The telemetry values appear when the corresponding data is available, otherwise “—” is shown; long lists are split into pages. The PS1 / SRT link type is described in Shared resource catalog, the protocols themselves in Peer protocols for reliable transmission.
Library
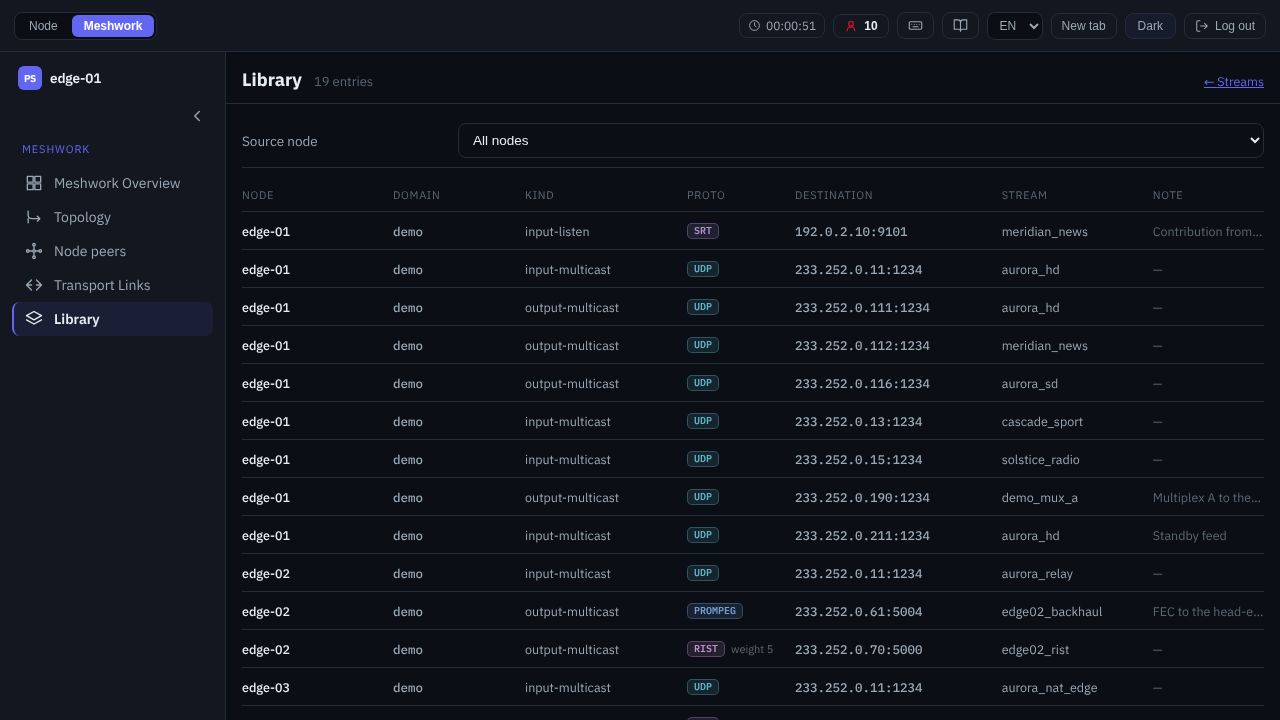
Domain resource library.
The shared catalogue of the network resources occupied in the domain: the inputs and outputs of the nodes over the UDP, RTP, Pro-MPEG and RIST protocols, as well as PS1 and SRT. The catalogue is built automatically from the node announcements and is read-only. It is used to pick free addresses and ports and to locate the required streams in the network. The header shows the total number of entries and the “← Streams” link.
Above the list there is the “Source node” filter: “All nodes” by default, with the value list holding the nodes that are announcing something right now. The filter selects the entries of a single announcing node and does not change the number of entries in the header. The rows are ordered by node, domain and address.
The columns: “Node” — the announcing node, “Domain”, “Kind” (the direction and the connection mode of the endpoint: output-multicast, input-caller, output-listen and the like), “Proto”, “Destination” (the address and the port), “Stream” (the name or the number) and “Note”. The address carries the link scope (“local”, “internal” or “external”; the same attribute exists for the transport links — Transport Links), the SSM source (SSM <address>) and the VLAN number (VLAN <n>). The link scope is shown only for the PS1 and SRT endpoints that connect to the specified address themselves (*-caller): “local” — an address of the same node, “internal” — a peer confirmed by the domain authorization, “external” — all the rest. For RIST the link weight (weight <n>) is shown next to the protocol.
A click on a row opens the admin UI of its node at the statistics of its stream: a row of the own node opens in place, a row of a neighbour according to the “Open nodes in” setting of the top bar (Common bar); Ctrl or ⌘ forces a new tab. The row of a node that is unavailable or unknown to the network has no action and carries the “Node unavailable” tooltip. The row tooltip shows the time the entry was announced.
The catalogue and the address selection rules are described in Shared resource catalog; the view from the standpoint of a single input or output is Library — this feed.
